

How to Manage Sales and Inventory Using Excel Templates
Set up connected Excel sheets for products, sales and stock levels, with formulas that update inventory automatically and highlight low stock.
Table of Contents
For many small shops and online sellers, Excel is the easiest way to track sales and stock. With three connected sheets and a few formulas, you can see what is selling, what is running low and how much you have earned.
1. Sheet 1: Product list
Create a table with SKU, product name, category, cost price, selling price, opening stock and reorder level. The SKU is the key that connects everything.
2. Sheet 2: Sales log
Record each sale with date, SKU, quantity, unit price and total. Use a drop-down list for SKUs to avoid typing errors, and XLOOKUP or VLOOKUP to pull the product name and price automatically.
3. Sheet 3: Stock in
Log new deliveries with date, SKU and quantity received. This keeps a clear record of restocking.
4. Calculate current stock automatically
On the product list, add a Current Stock column:
=OpeningStock + SUMIFS(StockIn[Qty], StockIn[SKU], [@SKU]) - SUMIFS(Sales[Qty], Sales[SKU], [@SKU])
Every new sale or delivery updates the stock level instantly.
5. Highlight low stock
Use conditional formatting to colour the Current Stock cell when it falls below the reorder level. You will see what to reorder at a glance.
6. Build a simple dashboard
- Total sales this month with
SUMIFSby date - Top five products by revenue
- Items below reorder level
- A monthly sales chart
Need inspiration for layout? Our Full Dashboard Design shows how to present key numbers clearly.
7. Present products and sales professionally
Share your range with customers using a Product Catalogue Template, and give buyers a branded receipt for every purchase.
Templates for this article
View all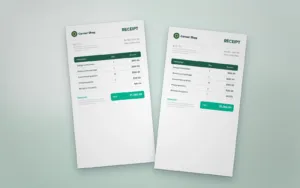


About the Author
Templateza TeamWe share practical tips, design guides and resources to help you create professional templates for business, print and digital use.